 MergenHub
 This walk-through takes you from a fresh installation to live values in an OPC UA client in about ten minutes. The screenshots use the built-in simulator so you can follow along without any hardware.
1. Sign in
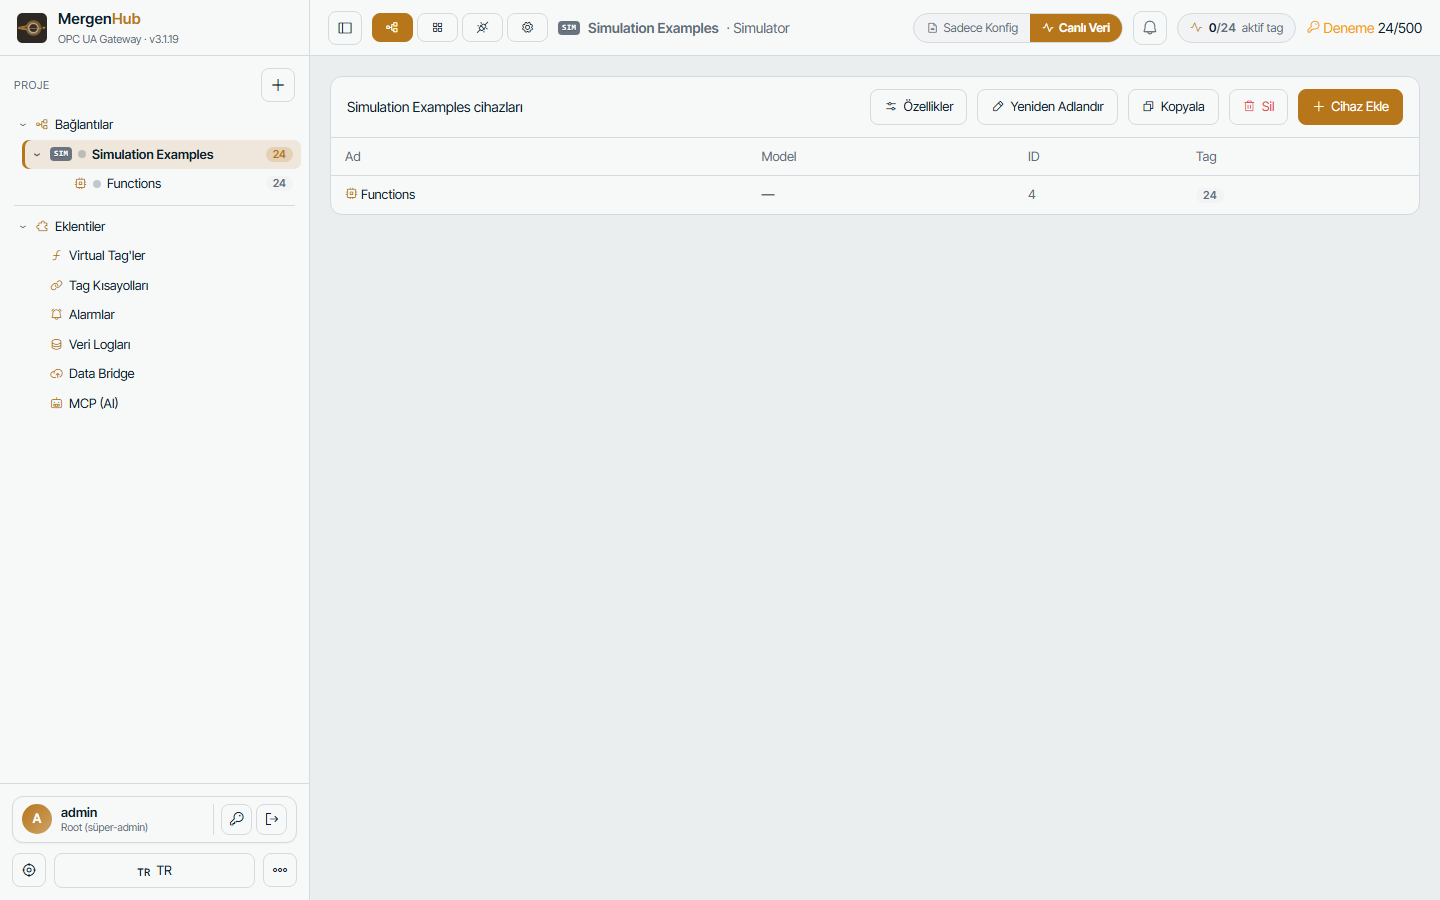
Open the web UI (http://localhost:8090 by default) and sign in as admin. The left tree is your project: Connectivity holds channels, devices and tags; Extensions holds virtual tags, aliases, alarms, historian, Data Bridge and MCP.
2. Add a channel
Click + Add channel, choose a driver and give it a name. For a real device pick the protocol (for example Modbus TCP/IP Ethernet); for this tour pick Simulator. Every driver has its own channel settings (network adapter, serial port, timeouts, retry policy) — the defaults are safe to keep.
3. Add a device
Select the channel and click + Add device. Enter the device's address (for Modbus TCP 10.0.0.5:502 plus the unit ID, for S7 the IP and rack/slot, for 61850 the IED address). Set the scan rate (how often the device is polled, in milliseconds) and, if needed, timeouts and retries.
4. Add tags
Select the device and use + Add tag or Generate tags:
- Add tag — name, address, data type, read/write, optional scaling and description.
- Generate tags — creates many tags at once from an address range or from the device itself (online browse for OPC UA, 61850, DNP3, IEC 104, OMRON NJ symbols, MQTT topics).
- Address hints — the ? next to the address field lists the address formats the driver understands, with examples.
5. Watch live values
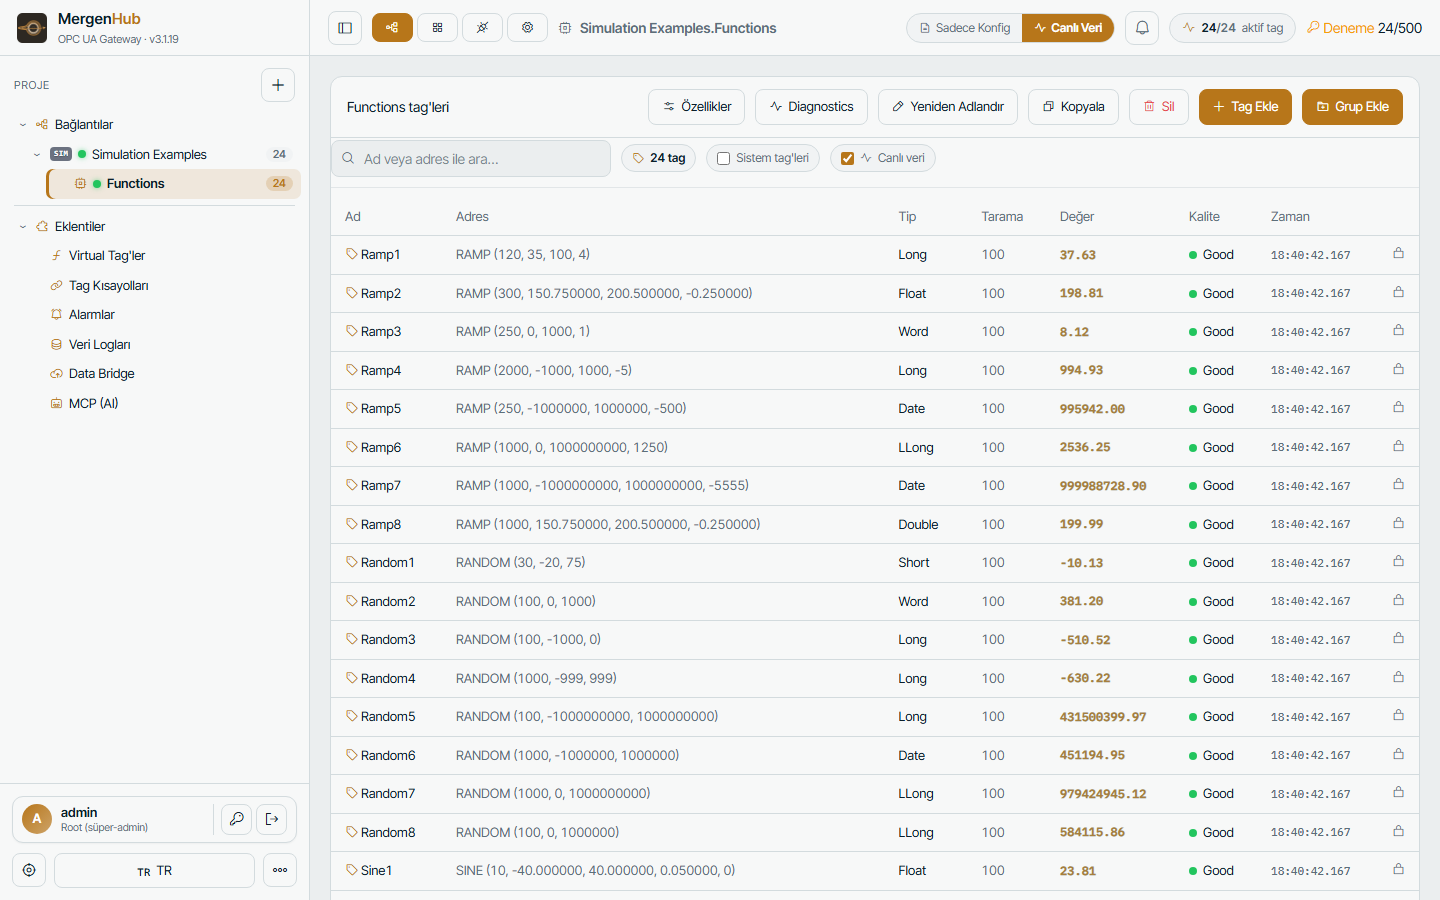
Switch the top bar to Live data. Each tag shows its current value, quality (Good / Bad / Uncertain) and timestamp. A red quality means the device could not be read; the Diagnostics button on the device shows the raw request/response frames and the last error.
6. Connect an OPC UA client
Point any OPC UA client (UaExpert, Kepware, Ignition, a PLC) to:
opc.tcp://<host>:48010/MergenHubBrowse Objects › <channel> › <device> to find your tags. With the installer defaults anonymous access and untrusted certificates are accepted; harden this later in Settings › OPC UA Server (security policy, user authentication, trusted client list). Details: OPC UA server.
7. Read the same values over REST
curl -c c.txt -X POST http://localhost:8090/auth/v1/login -H "Content-Type: application/json" -d "{\"username\":\"admin\",\"password\":\"<password>\"}"
curl -b c.txt "http://localhost:8090/runtime/v1/values?tags=Simulation%20Examples.Functions.Ramp1"
The full API is documented in the application under … › REST API (Swagger) and in REST API.
8. Build a first screen
Open SCADA, create a screen, drag a tank and a pump from the symbol library, bind their properties to tags and press Run. See SCADA / HMI.
What to configure next
- Alarms — thresholds on critical tags with e-mail/SMS notification: Alarms
- Historian — log groups for the tags you need trends on: Historian
- Users — operator accounts with limited rights: Users, groups and security
- Publishing — access from other sites or the internet: Publishing on a domain
- License — enter your key to lift the trial limits: Licensing