 MergenHub
 MergenHub keeps several kinds of logs, each with its own purpose, location and retention. All of them live under the data folder C:\ProgramData\MergenHub.
Overview
| Log | Where | What is in it | Retention | Where to view |
|---|---|---|---|---|
| Application file log | logs\mergenhub-YYYYMMDD.log | Everything the core process logs: startup, driver connections, errors, stack traces, API requests | One file per day; old files pruned automatically | Any text editor; attach to support requests |
| Event log | events.db (SQLite) | Operator-facing events: device connected/lost, timeouts, service start/stop, OPC UA sessions, alarms raised | 7 days by default (Settings › Retention) | … › Event Log in the web UI, with filter, search and Export to text |
| Audit log | audit.db | Who changed what: every configuration write (POST/PUT/DELETE), OPC UA and REST writes to tags, logins, MCP tool calls, license actions | 90 days by default | Settings › Audit (chip filters by category, user, time) |
| Alarm history | inside the project store | Every alarm transition: raised, acknowledged, cleared, by whom | 90 days by default | Alarms › History |
| Historian | logs.db (SQLite) or your ODBC database | Tag values recorded by log groups | Until you delete or downsample | Historian › Trend, CSV/Excel export, OPC UA HistoryRead |
| Device diagnostics | in memory | Raw request/response frames (hex) per device, last error, timing | Rolling buffer | Device › Diagnostics; Wireshark-style trace export |
| Installer log | %TEMP%\MergenHub-Setup.log | Every installer step, service and firewall commands | Until you delete it | Text editor |
| Windows Event Viewer | Application log, source MergenHub | Service lifecycle, unhandled crashes | Windows policy | eventvwr.msc |
Application file log
The core writes a rolling text log to C:\ProgramData\MergenHub\logs\. Each line has a timestamp, level (INF, WRN, ERR), the source component and the message. Typical entries:
2026-09-05 10:14:02.117 INF Web API listening on http://0.0.0.0:8090
2026-09-05 10:14:03.402 INF OPC UA server started: opc.tcp://0.0.0.0:48010/MergenHub
2026-09-05 10:14:05.930 INF ChannelWorker  Connected: Pumping_Station.PLC_1
2026-09-05 10:20:41.008 WRN ModbusTcp      Read timeout 10.0.0.5:502 unit 1 (block 40001..40064), retry 1/3
2026-09-05 10:20:44.012 ERR ChannelWorker  Device Pumping_Station.PLC_1 marked Bad: 3 consecutive failures
Settings › Retention controls how many days are kept. For a support case send the file of the day the problem happened.
Event log
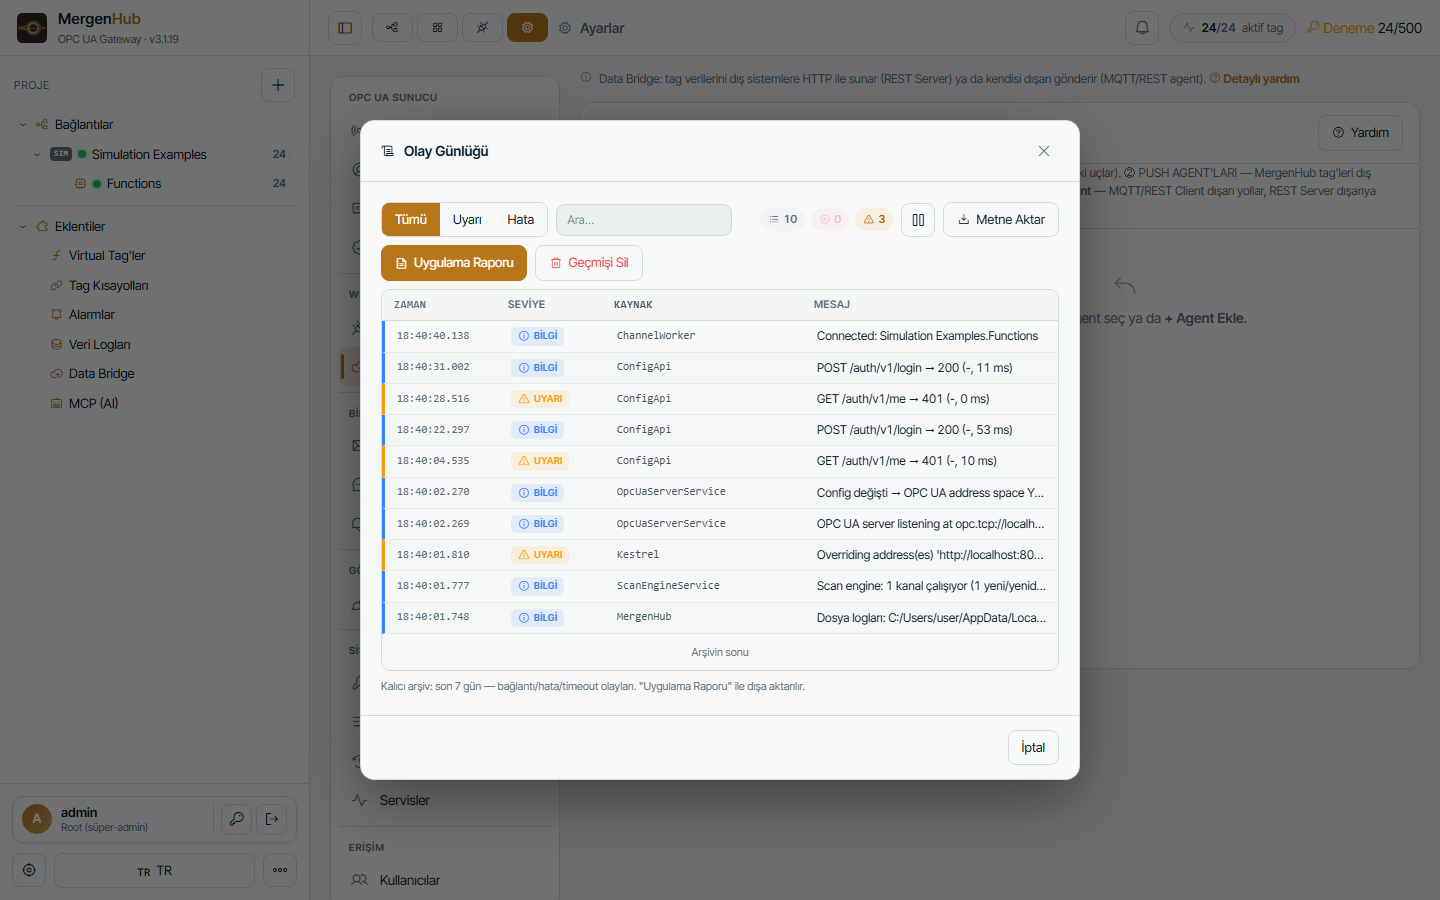
Events are what an operator needs to see without reading log files: connection state changes, timeouts, service restarts, OPC UA client sessions, configuration reloads, licence/trial messages. Open it from the top-right … menu › Event Log.
- Filter All / Warning / Error, free-text search, pause auto-refresh.
- Export to text saves the current view.
- Application Report builds a single text file with version, settings summary, channel/device health and the last events — the fastest thing to attach to a support ticket.
- Events are persisted in
events.dbfor the configured number of days (default 7) and survive restarts.
Audit log
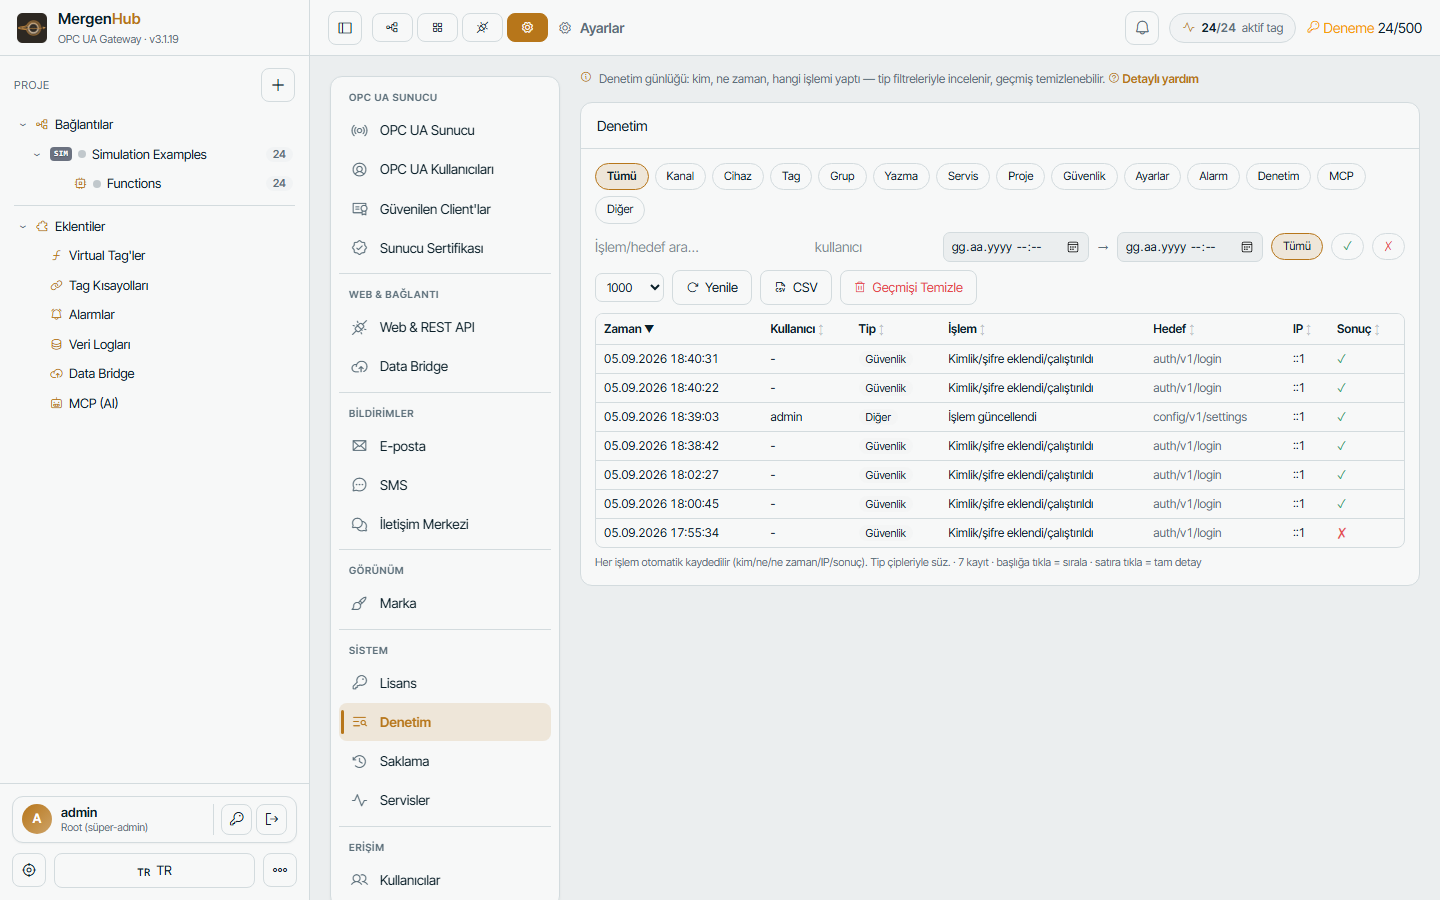
Every change made through the web UI, the REST API, OPC UA writes or an MCP tool is recorded with user, IP, time, action and target. Open Settings › Audit. Examples of what you will find:
channel.create,device.update,tag.delete,project.importtag.writefrom OPC UA or REST with old and new valueuser.login,user.login_failed,user.password_changelicense.activate,license.release,settings.update
Retention is 90 days by default (Settings › Retention). Audit records are never editable from the UI.
Alarm history
Every alarm transition (raised, acknowledged, cleared) with timestamp, value, user and comment is kept for the alarm-history retention (default 90 days) and shown under Alarms › History. It is also available to OPC UA Alarms & Conditions clients.
Historian data
Log groups write to logs.db (SQLite) by default or to any ODBC database (SQL Server, MySQL/MariaDB, PostgreSQL, Oracle). When the target is unreachable, records are buffered on disk (store-and-forward) and written later. Trends, downsampling and CSV/Excel/PNG export are in the Historian module; see Historian.
Device diagnostics and packet traces
Select a device and open Diagnostics: the last request/response frames in hex, byte counts, timing and the last error text. For cache-based protocols (DNP3, IEC 104, IEC 61850) the raw TX/RX tap shows the actual link traffic. A trace can be saved for analysis. See Troubleshooting.
Retention settings
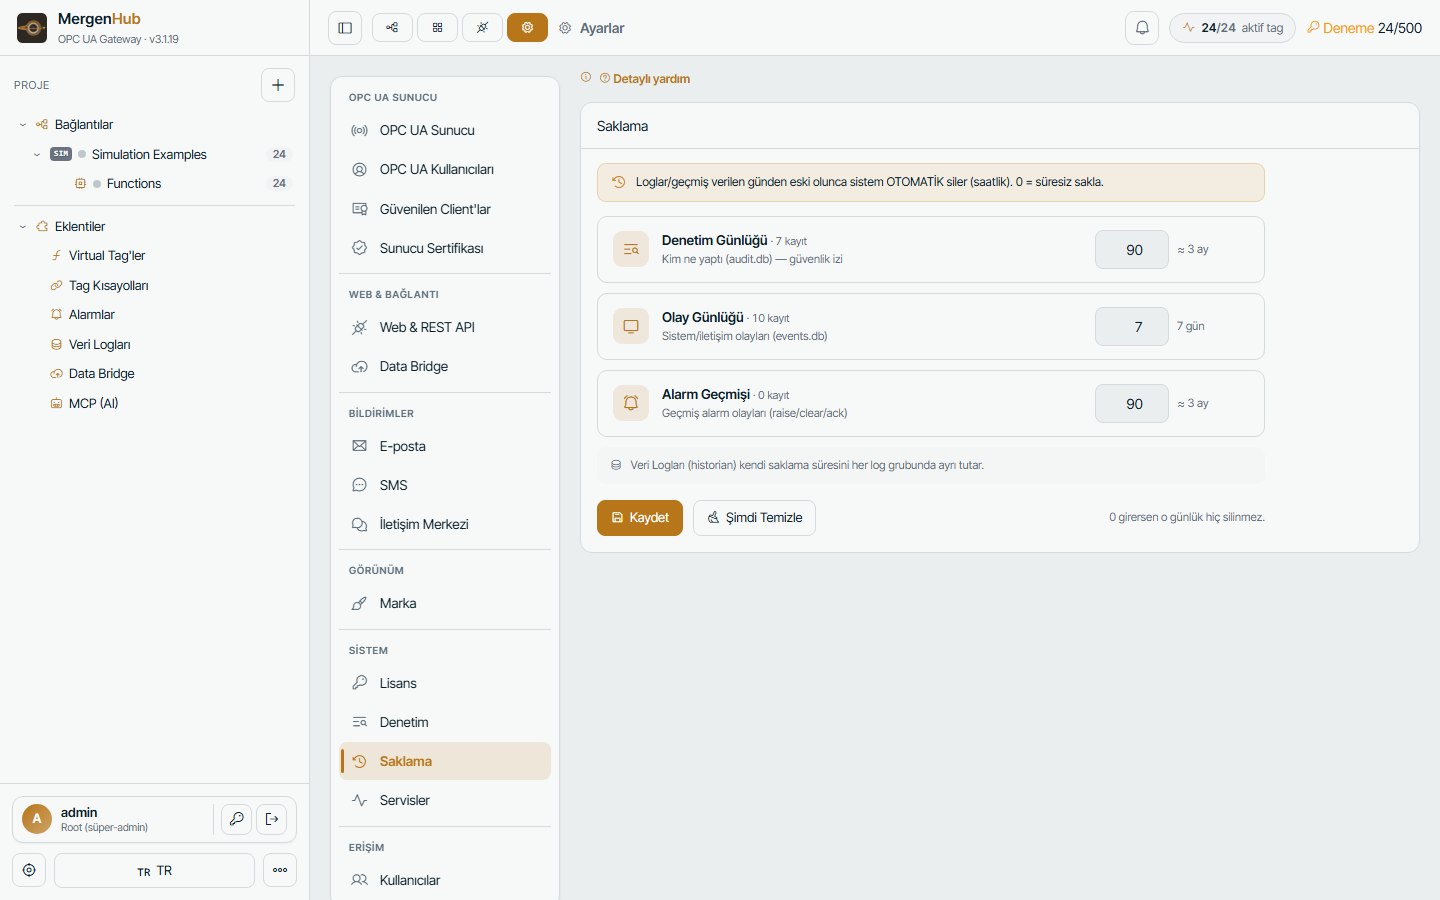
Settings › Retention:
| Setting | Default |
|---|---|
| Event log days | 7 |
| Audit log days | 90 |
| Alarm history days | 90 |
| File log days | rolling, automatic |
Sending logs to support
- … › Event Log › Application Report — save the file.
- Add the day's
logs\mergenhub-YYYYMMDD.log. - For a device problem add the Diagnostics trace of that device.
- Send them through the customer portal (Support) or by e-mail.